Azure Machine Learning Studio breaks down ML into five algorithm groups:
- Two-Class (or Binary) Classification
- Multi- Class Classification
- Clustering
- Anomaly Detection
- Regression
In this article we will explain the types of problems you can solve using the Azure ML Two-Class (or Binary) and Multi-Class Classification algorithms and help you build a basic model using them.
Hi, I’m Scott Davis, a Data Scientist for Valorem Reply and in this post I’m going to show you step-by-step just how easy (no coding required) it is to make a production-ready machine learning model in Azure ML using a private ML model I’ve created just for this post. Before we can jump in, you’ll need:
- An Azure ML account- If you don’t already have one, follow the steps outlined HERE to create a free one month account.
- Data for the tutorial - Access the private ML model I created HERE to import the data you’ll need to follow along step-by-step.
Before we get going it is good to understand that there are A LOT of things you can do with Azure ML. The purpose of this exercise is to get you started quickly with the tool by building a simple model using basic functionality in Azure ML. In future posts we’ll dive deeper into the tool and using Data Science concepts to make it work for your business needs. If you are ready for a deeper data science discussion now, Valorem Reply offers private consultations and envisioning workshops to help you kick start your data goals. For now, you can follow along with the steps below to see just how easy it is to build in Azure ML.
Summary
This experiment serves as a tutorial for building a classification model using Azure ML. For this example we will be using passenger data from the ill-fated maiden voyage of the RMS Titanic to predict the chances of survival for any given passenger (BTW there was totally room for Jack, but we won’t get into that). The completed model is included at the end of the tutorial.
Details
We are going to feed publicly available data on each Titanic passenger to the ML model and use this data to predict their chance of survival. The model will produce two numbers; the probability that the given passenger survived and a best guess (1 for survived and 0 for did not survive) on survival.
Step 1: Select and Visualize the Data for Your Model
Click on the Titanic Dataset within the private ML model you imported. When you do a 1 will appear. Right click on the 1 to see additional options. To make the best decisions for our model, it is best to get to know our data. So, before we begin, click the ‘Visualize’ option to see what data we are working with.
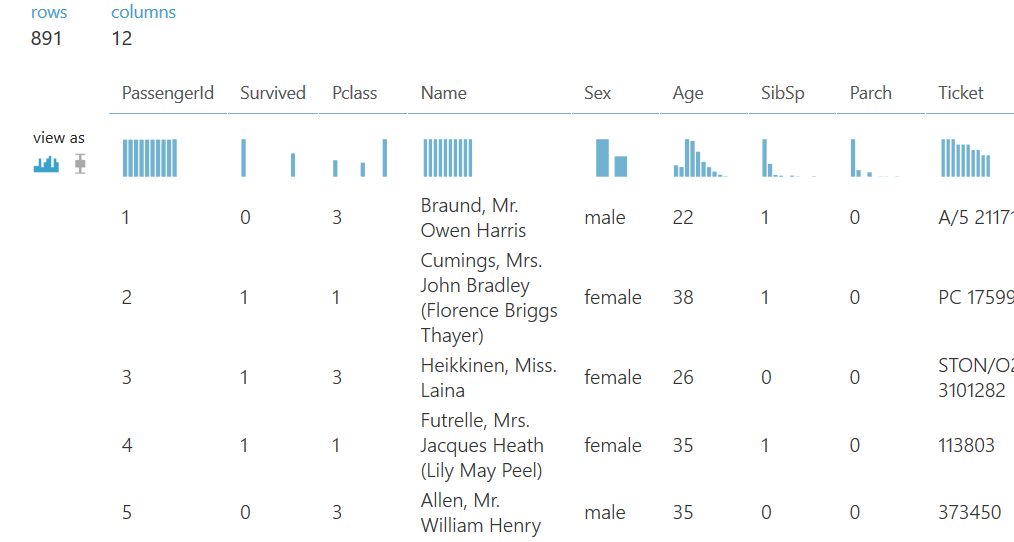
You should now see something like this:
Step 2: Simplify your data
Simplification is key so let’s get rid of the columns that we are not going to use. The data included in the ‘PassengerId’, ‘Name’, ‘Cabin’, and ‘Ticket’ columns don’t appear to give us any predictive information so we can remove them. It is important to note that there is no right or wrong way to create a ML model, you simply make decisions based on the data and context you have available. For example you may be thinking the cabin number could play a part in survival rate however, without additional details like the distance from each cabin to the lifeboats, the cabin number alone wouldn’t provide any value.
Type “Select Columns in Dataset” in the search bar and drag that box under the ‘Dataset’ box. Click and drag the node on the ‘Dataset’ box to the green node that lights up on the ‘Select Columns’ box to create a connection between the two nodes. Now our data is flowing from the dataset. You can add any notes by double clicking on the ‘Select Columns’ box. Adding notes helps others (and your future self) know what each step is doing. Now look at the right side of the screen. Click the “Launch column selector” button. You should see a box that looks like this: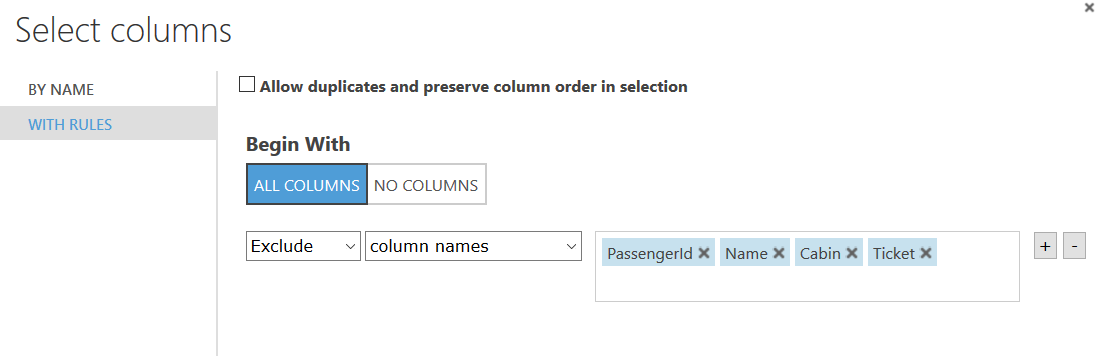
Click into the empty box. It should auto populate the column names (you may have to click out and back in if you don’t see the columns autofill). Pick the 4 options shown in the screenshot above.
When you are done click the check box on the bottom right. Note: You can always click into the box and right click the 1 to visualize your data again.
Step 3: Organize Your Data
In the next step we are going to do two things at once to make our data easier to use. Type “Edit Metadata” in the search box and drag it under the ‘Select Columns’ box and connect the two nodes like we did in the first step.
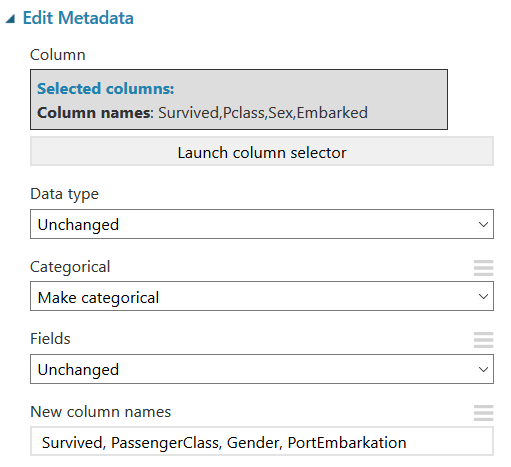
Once your ‘Edit Metadata’ box is connected to the ‘Select Columns’ box, click the box and click the “Launch column selector” again and follow the same steps as above to pick the following columns: ‘Survived’, ‘Pclass’, ‘Sex’, ‘Embarked’.
These are all passenger categories, and we’re going to change some of the category names to something more descriptive of the data it contains so it's easier to work with. Your results should look like this:
Next we will follow the same steps to drag another ‘Edit Metadata’ box below the last one and change the names of the remaining columns to more clearly describe the data they contain as well. It should look like this: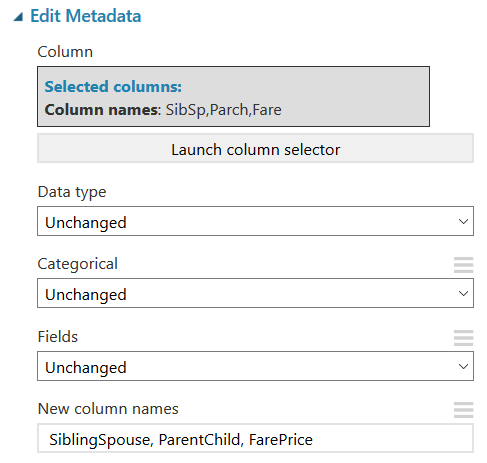
Step 4: Prevent errors
The next step is critical when it comes to ML and building a functional model. An exception (an error) occurs when one or more input data point is null or blank. To prevent the model from erroring out we need to either remove blank records or populate them with some value. Since the data available or solution requirements may vary from model to model, the method for doing this may vary. For example if your data set is large enough to maintain a statistically relevant quantity of data, you could simply remove the blank rows. To make a decision on the best way to handle nulls, start by looking at your data to see exactly how many null data points you may be dealing with.
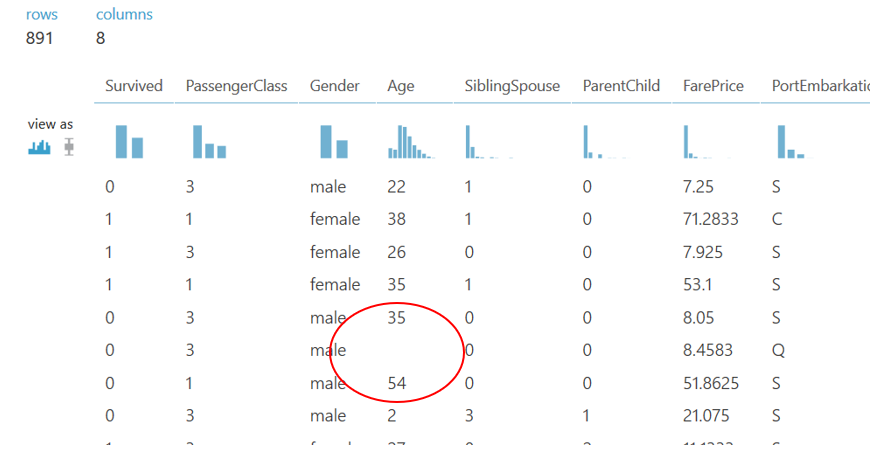
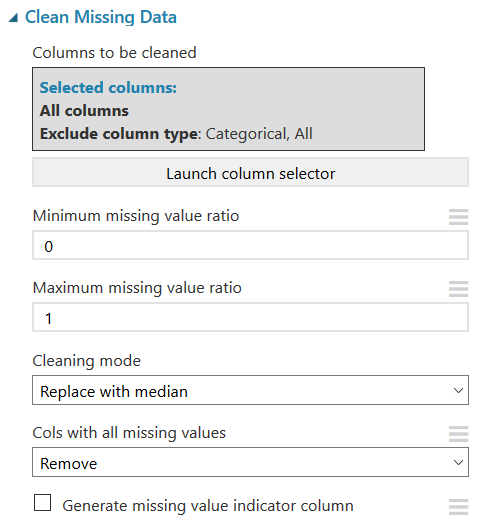
In our Titanic data example the only column that has blanks are the age column. We could remove each row with blank ages, but with only 891 rows of passenger data, that might not leave us with much data. For this dataset, the better option is to fill the blank data points with some non-influential number. For the purposes of this experiment, I’m going to use the median age of all the passengers in my data set. This may not be the best option, but it will be a starting point and we can always come back to this and change it later. In the search box type “Clean Missing Data” and drag it below the last ‘Edit Metadata’ box and connect the nodes, it should look like this:
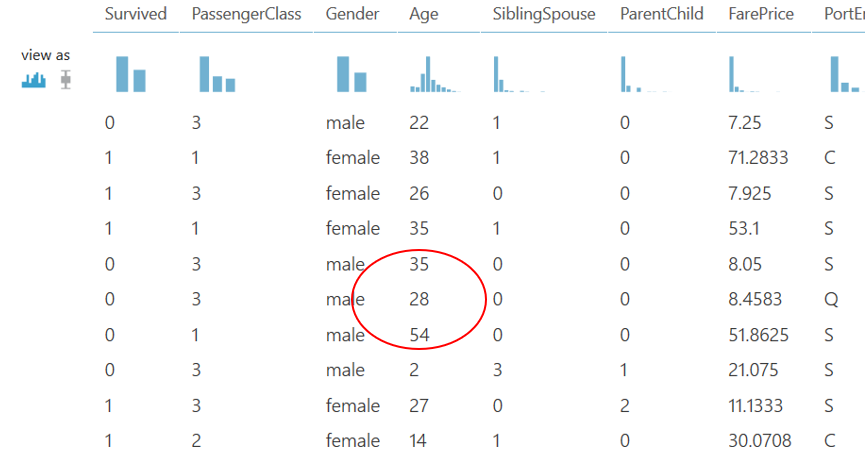
We can look at the results to verify the blank data points have been populated with 28, the median age for the data set.
Once this is done, our data is ready to run our model. However, as a precaution, I’m going to add two more of the Azure ML ‘clean missing data’ functions to protect the model from erroring out. Most likely these will not be needed but, it is a good idea to include as a precaution.
The first is a precautionary measure where we will use another ‘Clean Missing Data’ box to remove records. We should not have any blanks but, if we do, this function will remove any rows containing blanks to prevent a model error: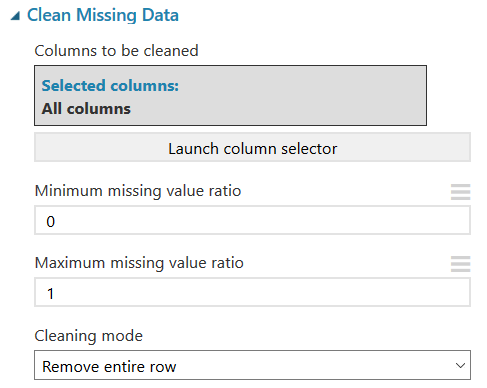
The next addition is going to use the “Edit Metadata” again to change our predictor type through the “Fields” option which tells Azure Machine Learning how to use the data in this model. We are going to change our predictor type from “Survived” to “Label.” Use this option to mark the label (also known as the predictable attribute, or target variable). Many modules require that at least one (and only one) label column be present in the dataset.
In many cases, Azure Machine Learning can infer that a column contains a class label, but by setting this metadata you can ensure that the column is identified correctly. Setting this option does not change data values, only the way that some machine learning algorithms handle the data.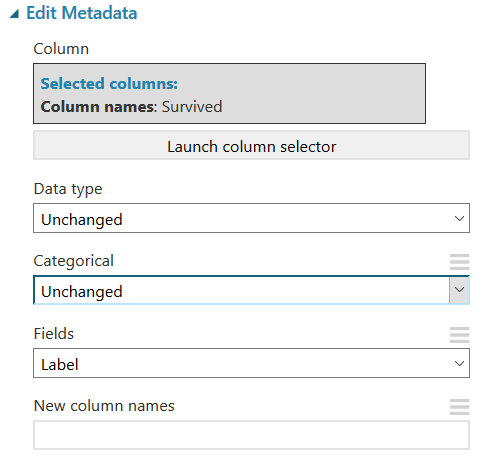
Step 5: Select Your ML Algorithm and Experiment
Now that our data is ready we need to pick an algorithm, but which one? Let’s use the Machine Learning Algorithm Cheat Sheet (11x17 in.) to help make our decision.
Since we are trying to answer a question that has only two possible outcomes (Is the passenger likely to survive? yes/no) a Two-Class Classification algorithm is our best choice. The cheat sheet gives you a quick look at the pros and cons of each Two-Class Classification algorithm to help you select the best for your ML need.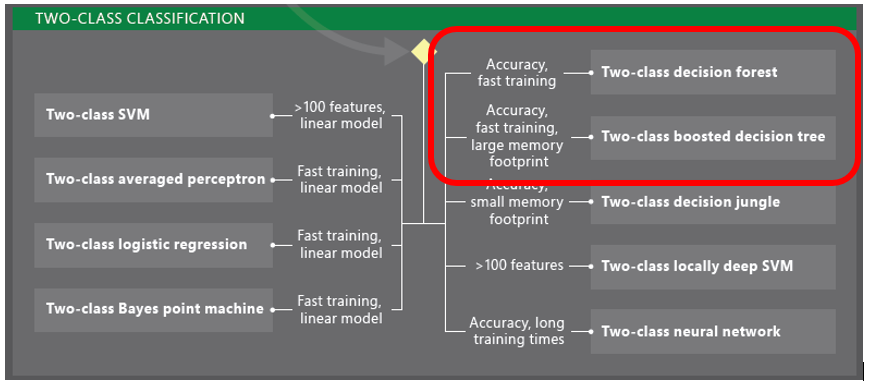
In this example we are going to try two different algorithms within the Two-Class Classification group and compare their results and see which is more accurate. We can easily experiment by swapping these models out and comparing their results with any of the others in this list to compare accuracy with our model output. In order to do that, we need to split our data before we add a model. Type “Split Data” in the search box, drag it into the workspace and connect it to our last ‘Edit Metadata’ box.
Now we can let the fun begin. Most ML classification models will need 3 modules however, my pro tip for you is to add two more. This will not impact your model output but will give you more information that could be useful in interpreting your results. In this example I’m going to bring in an additional two modules, one of which is the ‘Permutation Feature Importance’ module. This will show us which factors had the most impact on the output of whether a passenger survives, such as their age and gender. The other is ‘Evaluate Model’.
Drop in the following modules and connect everything as shown below: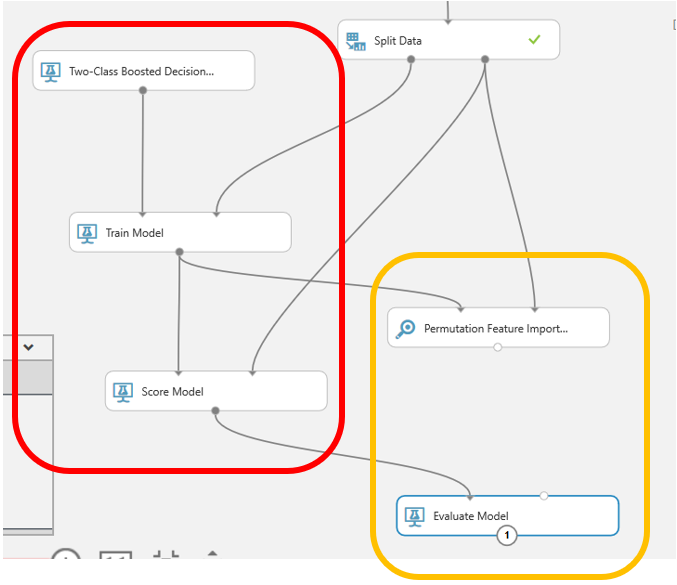
The red box indicates the required modules to run the classification. The yellow box indicates optional modules I’m using to evaluate the results.
Step 6: Set Training Criteria and Run Settings
Before we run the model, we need to set the criteria for training to tell Azure ML explicitly what we want it to focus on to learn. Start by searching for and selecting the “Train Model” module and select the column that we are trying to predict. In this case we will select Survived.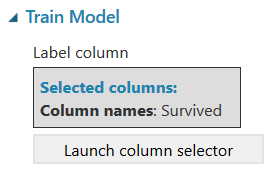
Next, we are going to click on our “Two-Class Boosted Decision Tree” box to select the settings for running the model. One of the biggest advantages of Azure ML is the settings are prepopulated. So if you are a beginner you can run with the prepopulated values to get a working model without getting stuck in the details. If you are a more advanced user and have brushed up on your stats, you can edit the prepopulated settings to further customize and modify your model before running. 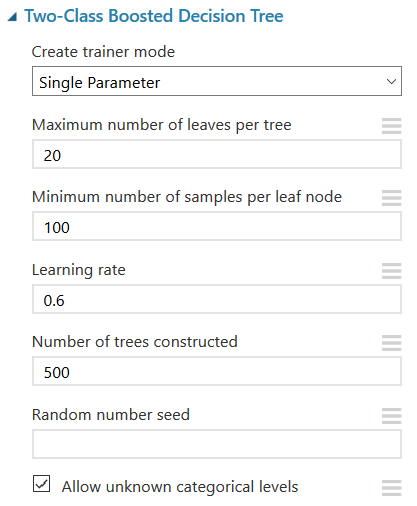
If you are unfamiliar with these features it would be a good time to search each one to understand what influence they have on the model. The great thing about the Azure ML platforms is that you are free to experiment with various values and evaluate the results.
Step 7: Run and Interpret Your ML Model
We are now ready to run the model. Click “Run” and wait for the results. Remember you can easily go back and add another model to compare outputs like what is shown in the complete ML model example created for this tutorial.
The actual output of the ML model is shown in two columns.
- Predicted outcome (labeled ‘scored labels’)- which tells us if the passenger likely survived. 1= yes, 0=no
- Probability of outcome (labeled ‘scored probabilities’)- which tells us their probability of survival

We will dive deeper into evaluating model results in future posts however, take a quick look at the ROC chart under ‘Evaluate Model’. This shows us at a glance that we get better results from the Two-Class Decision Forest.
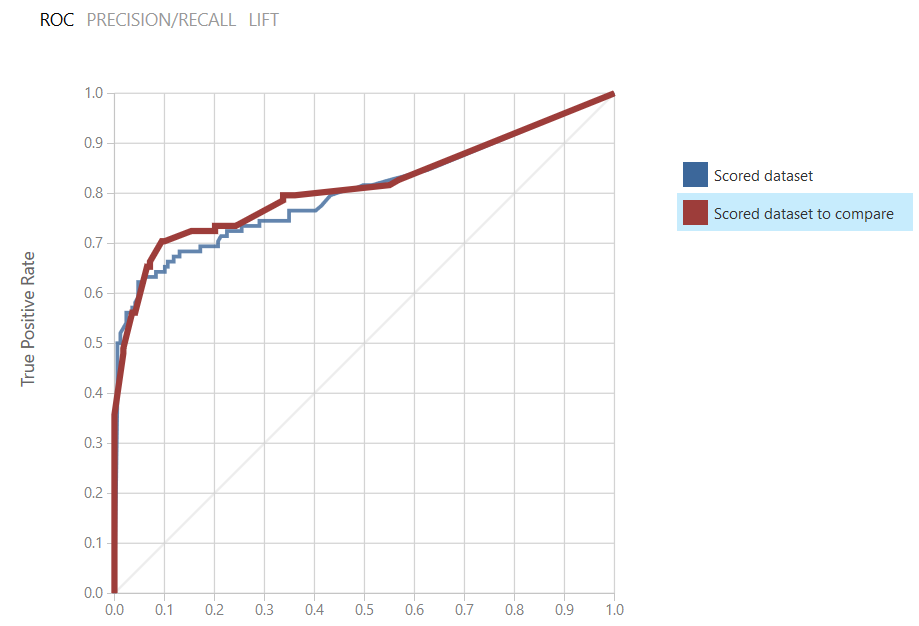
If you click on the datasets in the legend you will see the exact accuracy and precision results for each.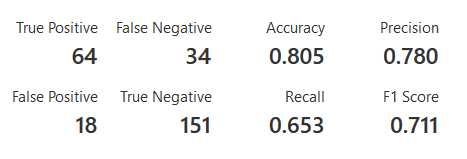
There is no right or wrong way to evaluate a model but rather an understanding of the problem you are trying to solve. For example, if you are trying to predict time sensitive issues, it is likely more important to you to use a model that takes less time to run even if another model that takes longer may have higher precision and accuracy. If you would like a deeper dive into model output and the science behind evaluating, experimenting and improving models to better serve your needs, comment below or reach out to us at marketing@valorem.com to speak with one of our data scientists. For now, pat yourself on the back because you have just built a machine learning model in a few easy steps!
Valorem Reply's Digital Insights Team is made up of highly experienced Data Analysts, Data Scientists and Digital Strategists with the expertise to:
- Accelerate data projects
- Solve tough business intelligence challenges
- Create a plan to transform your business data into competitive advantage
If you are interested in learning more about our data science services, solutions and team training, email us at marketing@valorem.com.